PAYLOAD INSTRUMENTS
HF Receiver
The HF Receiver is a broadband receiver for measuring wave fields from both manmade and spontaneous sources. Its basically has a preamplifier that matches the high impedance of the BOLAS dipoles to the 50-ohm input of the receiver signal processor. The latter comprises two branches. One is for direct amplification at frequencies up to 50 kHz. The other is a double heterodyne for frequencies between 100 kHz and 20 MHz, at 50 kHz steps. The receiver has considerable heritage from the OEDIPUS-C REX receiver.
The major difference from OEDIPUS-C REX is the differential phase measurement. Each BOLAS Receiver has its own 5-MHz reference signal from a GPS receiver. The GPS reference signals on the two endbodies are not synchronized, but sufficient information is available from the GPS telemetry to correct for frequency and phase errors using ground processing.
The preliminary specifications for the receiver plus preamplifier as given below:
Mass: 9 kg, plus cables*
Power: 10.8 W*
Size: Preamp - 127x99x33 mm *, Receiver - 295x257x175 mm ( separable into two or more units)*
Frequency range: 50 Hz to 20 MHz, not necessarily continuous
Instant. Bandwidth: 50 kHz*
Dynamic range: -100 to -10 dBm at 50 Ohm*
Diff. phase accuracy: Resolves direction of arrival to 5 degrees after ground processing
Output data: 100 000 16-bit samples per second*
Antenna: 6-m tip-tip dipole, parallel to tether, storable tubular BI-STEM elements from Astro Aerospace Corp.
Reference signal: 5 MHz from GPS receiver
Timing information: TBD, from GPS receiver
Preamplifier: Voltage gain=1; high impedance input; 50 Ohm output
(* based on OEDIPUS-C REX)
HF Receiver concept.
The HF receiver concept is shown in the figure above. The interferometer relation relates the accuracy of the DOA determination to that of the phase difference. It also implies that DOA error decreases with increasing frequency. There are two main sources of phase error in the receiver, namely the reference signal and the IF filters. The reference produces a phase error of theta R times (0.0066-0.2fs) where theta R is the phase error on the 5 Mhz reference and fs is the input frequency. The phase error associated with the IF filters is more or less independent of frequency but is expected to be sensitive to temperature. The error will be evaluated during phase A to determine if the OEDIPUS-C REX components are suitable. Temperature might be telemetered for ground processing corrections. The total receiver phase error is expected to be constant up to some corner frequency, above which it increases linearly with frequency. Correspondingly, the DOA accuracy will be nearly constant at high frequency and rise inversely with frequency below the same corner frequency.
Suprathermal Ion Instrument (SII)
The purpose of the Suprathermal Ion Instrument (SII) on BOLAS is to image the 2-D ion distribution from 0-50 eV, and to provide an integral measure of ion flux at rates sufficient to resolve localized ion heating structures on spatial scales of tens of meters.
The two SII's on BOLAS are identical and each consists of three parts: 1) a 2.5 cm diameter cylindrical sensor head with a rectangular baseplate housing electronics, 2) a 0.5 m (nominal) boom, and 3) a power and control unit housed inside the spacecraft bus. A sketch outlining the instrument and its +-5x360 degree field-of-view is shown in the figure below. The purpose for mounting the instrument on a boom is to allow biasing of the sensor skin to counteract spacecraft potential perturbations which can otherwise exclude low-energy ions from the sensor, and to place the sensor into the relatively undisturbed region outside of the spacecraft's Debye sheath.
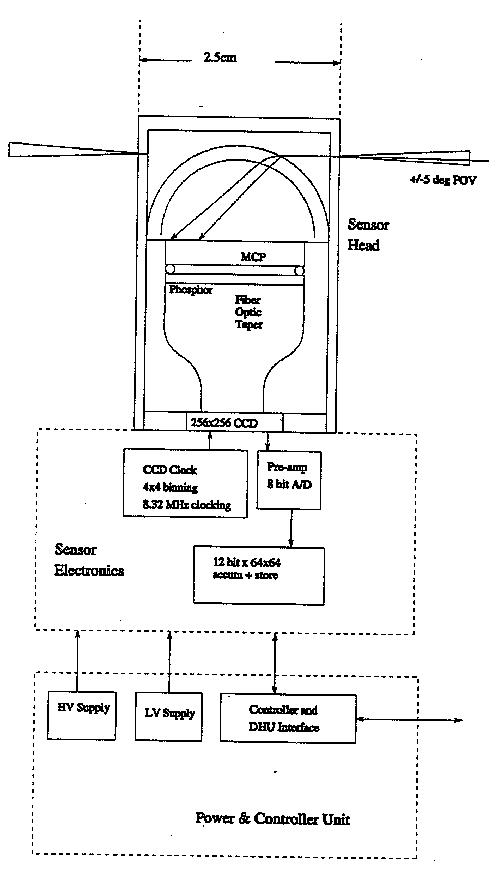
BOLAS Suprathermal Ion Instrument Configuration and Functional Diagram.
The data output of the SII will consist of 1) 64x64 12-bit pixel images of the 2-D ion distribution function, yielding 50 kbits per image, and 2) summed images at rates exceeding 1000 samples/s, for the purpose of detecting spatially localized features of the ion populations. Images will be accumulated at a rate of 5-10/s, depending on available telemetry.
A functional diagram of the instrument is shown in the figure above. Particles within the +-5 deg angular acceptance of the entrance aperture traverse the hemispherical grid region which disperses them across the detector disk according to their incident energy. A particle impact triggers a microchannel plate (MCP) firing at the landing position and the resulting charge pulse generates a burst of light at the phosphor screen located just behind the MCP. The phosphor image is transmitted through a reducing fiber optic taper and coupled to a 256x256 pixel charge-coupled device (CCD), where incident photons produce electrons within individual CCD pixels. A distribution of MCP firings is accumulated during an sub-intergration period of several ms, after which time the CCD image is rapidly transferred to a masked region, binned to produce 64x64 element images, digitized to 8 bits and summed into a 64x64, 12 bit memory buffer. Images are summed into memory over one integration period and are fed to the DHU for compression and transmission. The number of images per second will be chosen according to the amount of available telemetry.
A summary of instrument specifications for the SII is as follows:
Mass: Sensor-500 gm, Boom-1 kg, PCU-3.5 kg, total-5 kg
Power: 10 W average, 20 W Peak
Field of view: (5x360 deg in a plane perpendicular to the boom
Boom: 1.0 m
Telemetry: 50 kbits/image, 1 image/s
Dimensions: (sensor) 2.5 cm dia cylinder, 5 cm long, 10x10x2 cm square baseplate. (PCU) 19 x 18 x 7.6 cm
Sensor skin bias: -10 < V_skin < 10 V (must be isolated from boom)
Attitude Knowledge: Sensor rotation about boom axis must be known to within 1 deg
Angular resolution: 10 deg
Energy range: 0 eV (with an accelerating sensor skin potential) to 100 eV. E_max/(E_min + qV_skin) = 10
Energy resolution: dE/E = 15%
The SII is based on the design of the Freja Cold Plasma Analyzer but with two major modifications: 1) while the general design of the electrostatic deflection system will be similar to the CPA's, the dimensions will be shrunk by a factor of roughly 3, and 2) we will pursue a detector design based on a charge-coupled device (CCD) rather than a network of charge amplifiers as was used for CPA. The motivation for reducing the size is to reduce mass and to diminish distortion due to the small particle gyroradius at low energies. The problem of gyroradius distortion is more severe for electrons than ions, but both measurements benefit from smaller instrument size.
The are several reasons for pursuing a CCD-based detector design. First, electro-optical detectors offer a promising solution to problems such as gain variation, crosstalk, and RF interference inherent in charge-amplifier networks such as that used in the Freja CPA. State-of-the-art CCD-based detectors produce images which are uniform across their surface to within 10% or better, and with calibration one can correct for much of the remaining variability. A second motive for the CCD approach is that whereas both charge-amp networks and resistive anode schemes require sequential processing to calculate the position of individual events, a CCD can accumulate events simultaneously across its surface and hence can achieve higher total event rates - up to the 10^8 events/cm^2/s at which state-of-the-art high dynamic range MCP's saturate. Thirdly, the sensitive detector element in a CCD-based scheme is optically isolated from the large MCP voltage bias 2 kV for a chevron stack) and is less susceptible to damage from HV discharges.
Thermal electron capped hemispherical sensor (TECHS)
The thermal electron capped hemisphere spectrometer (TECHS) instrument has been developed to measure the distribution function of low energy and thermal electrons in the ionospheric plasma. A version of the instrument has flown successfully on the SCIFER sounding rocket, yielding the first differential directional thermal electron phase space density measurements ever obtained in the ionosphere. From these measurements, integral moments of the electron distribution function, including density, anisotropic temperature, bulk drift, and heat flux may be derived.
The TECHS resource requirements are:
Mass: sensor and boom: 1 kg; electronics box: 3 kg
Power: 5 W average
Field of view: +-4 x 360 deg in plane perpendicular to the boom
Boom length: 1.0 m
Telemetry: 30 bin angles x 1 energy per ms => 30 kB/s = 240 kb/s
Dimensions: sensor: 2.5 cm dia x 5 cm long; electronics: 19 x 18 x 7.6 cm
Sensor Skin bias: +1 V
Attitude Knowledge: +-1 deg
Angular resolution: 10 deg
Energy range: 0.3 - 100 eV
Energy resolution: dE/E = 8%
The TECHS instrument is an azimuthal imaging tophat electrostatic analyzer. By sweeping the analyzer voltage the instrument measures a count rate that can be directly related to the particle distribution function. In its configuration for the upcoming CAPER sounding rocket, the instrument electronics occupies roughly 3000 cm-3, with a mass less than 2 kg. The sensor is roughly the size of a 35 mm film can, approximately 2.5 cm diameter by 5 cm long. A sketch of the electrostatic analyzer flown on SCIFER and an instrument block diagram are presented in the following two figures below.
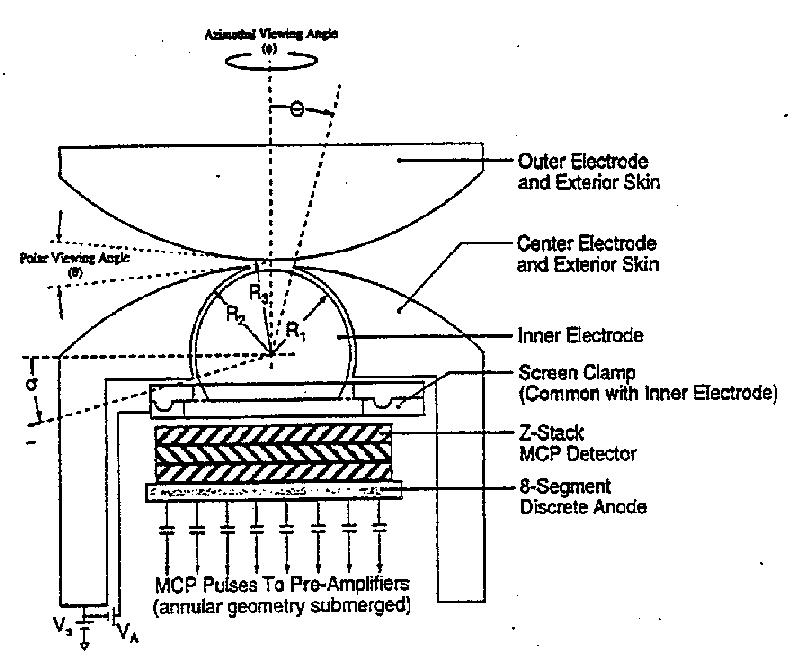
Cross section of TECHS electrostatic analyzer as flown on the SCIFER sounding rocket. Actual dimensions in the flight sensor were: R1=0.233", R2=0.250", R3=0.267".

Conceptual block diagram of the TECHS instrument.
Charged particles incident on the entrance aperture from different azimuth angles are selected for energy and directed onto corresponding sites along an annular region of the detector, yielding an azimuthal angular image. The TECHS instrument has been designed to be deployed on a boom measuring up to 1 m in length by 3 cm diameter. By deploying the analyzer in this way, spurious counts and shadowing of the detector by the spacecraft body are greatly reduced. To combat the effects of spacecraft charging on the TECHS measurements, an electrically isolated segment of sensor skin is located at the end of the deployed boom and biased with respect to the spacecraft potential. The center and outer electrodes of the TECHS instrument are held at this biased potential, while the inner electrode is swept to positive selection voltages. Biasing the relatively small sensor head area with respect to the large payload area allows forcing of the sensor head toward the plasma potential without driving the payload bias significantly.
Maximum sample rates for a TECHS type instrument are determined by a combination of differential directional flux, the per-bin instrument geometric factor, and the per-bin instrument saturation characteristics. Millisecond sampling of a 32 channel TECHS device over two decades in energy will allow 250-m spatial resolution with 15% energy resolution and 10% statistical significance at 100 kHz. Increased spatial resolution may be achieved through either reduced sampling performance in energy or angle, reduced statistical performance, or enhanced micro-channel plate performance.
Global Positioning System (GPS) Receiver
GPS receivers are designed to collected and process signals from the Global Positioning System (GPS) - a passive global satellite navigation system, developed by the Department of Defense in the United States. Depending on the quality of the receiver components, very accurate time, position and velocity can be obtained, as well as vector determinations between receivers.
The specifications of the baseline receiver are given below:
Mass: sensor and boom: 3 kg
Power: 6 W
Dimensions: 21.1 x 21.1 x 3.72 cm
Signals tracked: L1 and L2 carrier phases; both codes (C/A and P); and P-codeless (cross correlation)
Channels: 8 (8 satellites can be tracked simultaneously)
Field of view: approx. 360 deg utilising two (proposed) specially designed L-band antennas
The engineering applications and associated accuracy requirements of the receivers (one on each subsatellite) are as follows:
5 MHz reference frequency: +- 4x10^-7*
time synchronisation: +- 10 ns
precise orbit determination: +- 20 cm
attitude determination: +- 1 deg
real-time orbit determination: +- 100 m
(*integration period of 300 microsec)
Most geodetic-grade GPS receivers are designed with similar architectures. The figure below illustrates the major components of a single channel receiver. Signal channels are used to isolate the signals from each GPS satellite being observed, except in the case of sequencing receivers, where signals from more than one GPS satellite can be continuously sequenced through the channel. In this approach, more than one satellite can then be tracked with a single physical channel.
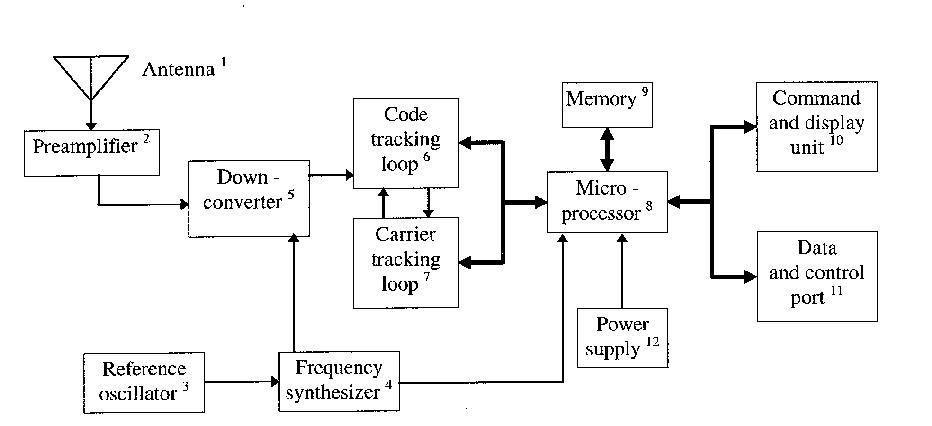 Major components of a generic single-channel GPS receiver.
1. The antenna converts the energy arriving in the electromagnetic waves from the satellites to an electrical current. 2. These signals are very weak and must be strengthened by passing them through a low noise preamplifier before they enter the receiver. The preamplifier generally includes burnout protection to protect the preamplifier from strong signals in the unwanted radio frequency (RF) environment received through the antenna, filtering to suppress the unwanted RF environment, and a low noise amplifier (LNA) to provide gain.
Major components of a generic single-channel GPS receiver.
1. The antenna converts the energy arriving in the electromagnetic waves from the satellites to an electrical current. 2. These signals are very weak and must be strengthened by passing them through a low noise preamplifier before they enter the receiver. The preamplifier generally includes burnout protection to protect the preamplifier from strong signals in the unwanted radio frequency (RF) environment received through the antenna, filtering to suppress the unwanted RF environment, and a low noise amplifier (LNA) to provide gain.
3. The reference oscillator used is usually a temperature-compensated crystal oscillator (TCXO) or an oven-controlled crystal oscillator (OCXO). The latter is more stable, larger and requires significantly more power. 4. The reference oscillator is used by the frequency synthesizer to generate a pure sinusoidal signal for down conversion of the received GPS signals. This signal is sometimes referred to as the local oscillator (LO) signal. The frequency synthesizer may generate additional signals for signal processing.
5. The down-converter mixes the received RF with the LO to produce a lower frequency signal, more manageable by the rest of the receiver, called the intermediate frequency (IF). Most receivers employ multiple IF stages, reducing the carrier frequency in steps. Unwanted signals, such as sidebands, are removed by filtering. The down-converter also performs the analog to digital conversion for many of today's receivers.
6. and 7. The tracking loops are used to make pseudorange and carrier phase measurements and to extract the broadcast message from the GPS signals. Both tracking loops, the delay lock loop for code tracking and the phase lock loop for carrier phase tracking, are feedback devices. They basically compare the incoming signals against locally generated signals derived from the LO, generate error signals that are the differences between the two, and uses these signals to adjust the receiver generated signals to match the incoming signals. The signal from each specific satellite is tracked in a specific signal channel. Some receivers may however, allow for more than one satellite signal to be tracked in a specific channel (multiplexing). Again, the given block diagram is for a single channel receiver.
During times of scientific data collection with the HF receivers, each GPS receiver will output a 5 MHz reference signal and a pulse once per second. In order for the reference signal to be smooth, no receiver clock steering to GPS from the GPS signals will be performed. In post-processing, highly accurate (+- 10 ns) relative time synchronisation between the receivers will be obtained.
When Anti-Spoofing (AS) is engaged, as is the case most of the time, for all but one of the Block II GPS satellites, P-codeless tracking must be undertaken to measure L2 carrier phases. This is because both the C/A and P-codes are present on L1, but only the P-code is present on L2. This tracking can be accomplished in a number of ways. In the signal squaring technique, by electronically squaring the GPS signal, the codes and broadcast message are removed from the signal and the resulting signal frequency is double the original. In the codeless cross-correlation technique, the L1 signal is delayed and mixed with the L2 signal, so as to again remove the codes and broadcast message. But in this process, the frequency of the resulting signal is the difference between the L1 and L2 frequencies. The wavelength corresponding to this frequency is longer than the resulting wavelength from the previous method and therefore allows for less problematic resolution of the carrier phase ambiguities. Another family of techniques take advantage of the fact that L1 and L2 have the same P-code modulation/encryption (with AS turned on). The P-code can be synthesized with C/A-code aiding and as with the first two techniques, semicodeless squaring and semicodeless cross-correlation techniques can be applied to phase tracking.
8. The microprocessor interacts with basically all of the receiver components. It uses digital samples of pseudorange, carrier phase and the broadcast message to determine position, velocity, and time. It may also filter the raw data to reduce the effect of noise or to determine improved positions and velocities in dynamic situations (e.g. with the use of a Kalman filter).
9. Data (carrier phase and/or pseudorange measurements and broadcast messages) are usually stored using semiconductor memory.
10. The majority of receivers have user interfaces consisting of a keypad and display, designed for entering and/or storing coordinates, meteorological data, satellite status, time, site information (for static positioning), and other information. The TurboStar has no such physical interface
11. Receivers with output capabilities generally have an RS-232-C or similar kind of communications port. The TurboStar has a RS-422 serial port.
12. Most receivers have internal DC power supplies, usually in the form of rechargeable nickel-cadmium (NiCd) batteries, or can be powered by external battery packs or have AC to DC converters.
The scientific application consists of ionospheric occultation measurements and the combination of these measurements with ground-based measurements using computer tomography. Precise phase measurements and orbit determination solutions are required to provide the required inputs to the occultation to electron density profile conversion algorithms.